
阅读视图

发现新文章,点击刷新页面。

Network Bandwidth Monitoring Tools: iftop, nload, bmon, and vnstat

When a server feels slow or a connection is saturated, the first question is usually “what is using the bandwidth?” The answer depends on what you need to see: the total rate on an interface, the individual connections moving the most data, a graph across several interfaces, or how much you have transferred this month. No single tool does all of this well, so it helps to know which one fits each question.

This guide compares four command-line bandwidth monitors: nload, iftop, bmon, and vnstat. Each one is small, available in the default repositories, and built for a different angle on network usage.

nload: Per-Interface Throughput

nload is the simplest of the four. It shows the incoming and outgoing rate on a single interface in real time, with a small ASCII graph and running statistics. It answers the question “how fast is this interface moving data right now?”

Install it on Ubuntu, Debian, and Derivatives:

Terminal
sudo apt install nload

On Fedora, RHEL, and Derivatives, install it with dnf. On RHEL-compatible systems, enable EPEL first if the package is not available:

Terminal
sudo dnf install nload

Run it with no arguments to monitor the default interface, or name an interface directly:

Terminal
nload eth0

The display splits into incoming and outgoing sections, each showing the current rate along with the average, minimum, maximum, and total transferred:

output
Device eth0 [192.168.1.50] (1/1):
Incoming:
Curr: 4.21 MBit/s
Avg: 2.88 MBit/s
Max: 9.10 MBit/s
Ttl: 1.42 GByte
Outgoing:
Curr: 512.00 kBit/s
Avg: 320.10 kBit/s

When more than one interface is present, the left and right arrow keys cycle between them. Press q to quit. nload does not need root privileges, which makes it the quickest way to glance at raw throughput.

iftop: Bandwidth by Connection

nload tells you how much traffic is flowing, but not where it is going. iftop fills that gap. It works like top for the network, listing active connections sorted by bandwidth so you can see which hosts and ports are responsible for the load.

Install it on Ubuntu, Debian, and Derivatives:

Terminal
sudo apt install iftop

On Fedora, RHEL, and Derivatives, use dnf. On RHEL-compatible systems, enable EPEL first if the package is not available:

Terminal
sudo dnf install iftop

iftop needs to capture packets, so it must run as root. Point it at an interface:

Terminal
sudo iftop -i eth0

Each row shows a pair of hosts and the bandwidth between them, averaged over the last 2, 10, and 40 seconds:

output
 => 192.168.1.50 4.10Mb 3.85Mb 3.20Mb
192.0.2.14 <= 256Kb 210Kb 180Kb

By default iftop resolves IP addresses to hostnames and port numbers to service names, which can be slow and can clutter the view. Three flags make it more useful on a busy server: -n skips DNS hostname lookups, -N shows ports as numbers instead of service names, and -P displays the port column so you can tell which service is responsible:

Terminal
sudo iftop -i eth0 -nNP

Press q to quit. When you need to find the connection saturating a link, iftop is the tool to reach for. To then identify the local process behind a port, pair it with the ss command .

bmon: Multiple Interfaces at a Glance

bmon (bandwidth monitor) is the right choice when you want to watch several interfaces at once. It lists every interface with its current receive and transmit rates, and draws a live graph for the one you select, which is handy on routers, gateways, and virtualization hosts with many NICs and bridges.

Install it on Ubuntu, Debian, and Derivatives:

Terminal
sudo apt install bmon

On Fedora, RHEL, and Derivatives, use dnf. On RHEL-compatible systems, enable EPEL first if the package is not available:

Terminal
sudo dnf install bmon

Launch it with no arguments:

Terminal
bmon

The top pane lists all interfaces with their RX and TX rates. Use the arrow keys to highlight an interface, and the lower pane updates its graph to match. Press d to toggle detailed counters such as errors and dropped packets, and q to quit. bmon reads kernel counters and does not require root for basic monitoring.

vnstat: Historical Usage Over Time

The first three tools show what is happening now and forget it the moment you quit. vnstat is different: it runs as a background service, records traffic per interface into a database, and reports usage by hour, day, and month. It answers “how much data have I used this month?” rather than “what is the rate right now?”, which makes it the tool for usage caps and capacity planning.

Install it and enable the service on Ubuntu, Debian, and Derivatives:

Terminal
sudo apt install vnstat
sudo systemctl enable --now vnstat

On Fedora, RHEL, and Derivatives, install the package first. On RHEL-compatible systems, enable EPEL first if the package is not available:

Terminal
sudo dnf install vnstat
sudo systemctl enable --now vnstat

vnstat needs time to collect data, because it samples the interface counters periodically rather than capturing packets. After it has been running for a while, view a summary:

Terminal
vnstat
output
 eth0 since 2026-01-01
rx: 42.18 GiB tx: 8.04 GiB total: 50.22 GiB
monthly
rx | tx | total
------------------------+-------------+------------
2026-01 42.18 GiB | 8.04 GiB | 50.22 GiB

Several flags change the reporting period: vnstat -h for hourly, vnstat -d for daily, and vnstat -m for monthly. For a live rate display similar to the other tools, use vnstat -l, which shows the current throughput until you press Ctrl+C. Because the daemon keeps logging, the history survives reboots.

Which Tool to Use

The four tools overlap a little but each has a clear best use:

Tool Shows Needs root Best for
nload Per-interface in/out rate No A quick glance at total throughput
iftop Per-connection bandwidth Yes Finding which host or port is using the link
bmon All interfaces plus graphs No Hosts with many interfaces
vnstat Historical hourly/daily/monthly totals No Tracking usage over time and quotas

In practice, many administrators keep vnstat running for history and reach for iftop when they need to investigate a live spike.

Troubleshooting

command not found after installing
Confirm the package installed with apt list --installed | grep <tool> or dnf list installed <tool>. On Ubuntu, the package may be in the universe repository; on RHEL-compatible systems, you may need to enable EPEL first.

iftop shows no traffic
iftop must run as root and be pointed at the active interface. List interfaces with ip link and pass the correct one with -i. Traffic on the loopback interface will not appear unless you select lo.

vnstat reports “Not enough data available yet”
The daemon has not collected a full sampling interval. Confirm the service is running with systemctl status vnstat and wait a few minutes for the first data points.

Rates look wrong on a virtual interface
Bridges, bonds, and VLAN interfaces report aggregate counters. Monitor the underlying physical interface as well to see where the traffic actually enters the host.

FAQ

Which tool shows bandwidth per process?
None of these four map traffic to a process directly. iftop shows it per connection; to tie a connection to a process, use ss -tp or nethogs, which groups bandwidth by process.

Do these tools work over SSH?
Yes. All four are terminal applications and run fine in an SSH session, which is exactly how they are used on headless servers.

Does vnstat slow down the network?
No. vnstat reads interface counters periodically rather than inspecting packets, so its overhead is negligible even on busy links.

Can I monitor a specific interface only?
Yes. nload, iftop, and vnstat all accept an interface name (for example eth0), and bmon lets you select one from its list.

Conclusion

Pick the tool that matches the question: nload for a fast look at throughput, iftop to find the connection eating the link, bmon for many interfaces, and vnstat for usage history. When you need to move from bandwidth numbers to sockets and interface details, pair them with the lower-level ss and ip commands.

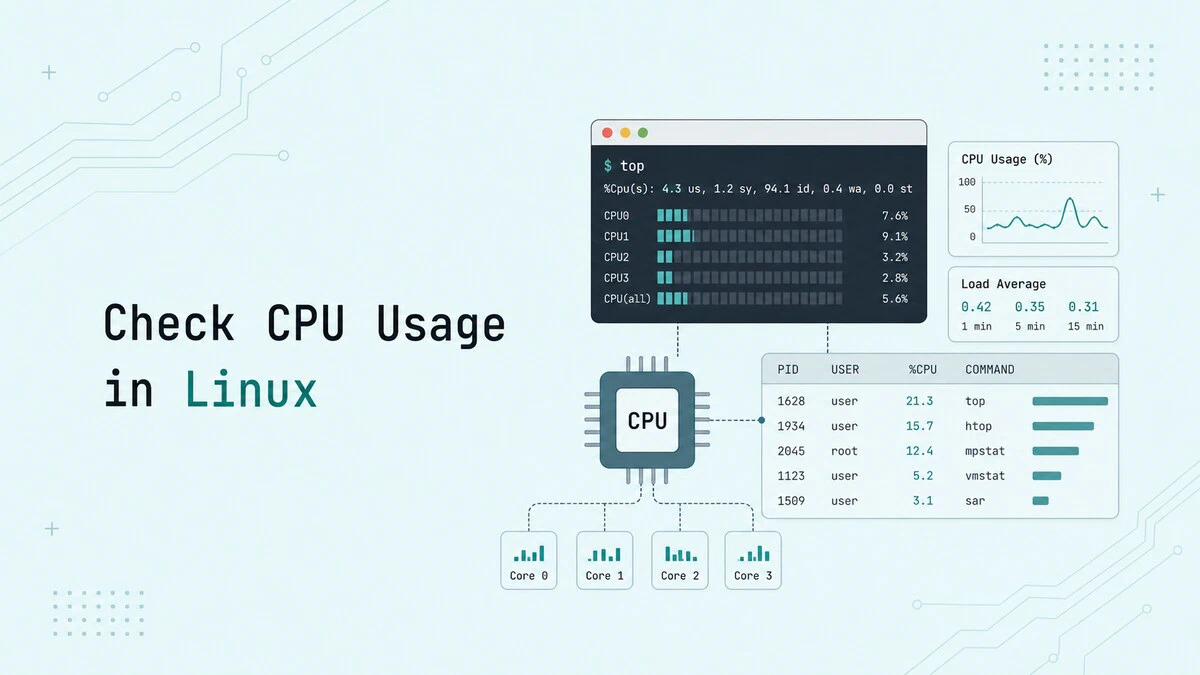
How to Check CPU Usage in Linux

A Linux server tells you what its CPUs are doing through several built-in tools, each with a different angle. top and htop show the live picture. mpstat, vmstat, and sar from the sysstat package report numeric samples that suit scripts and dashboards. ps attributes usage to specific processes, and uptime summarizes the load over the last fifteen minutes.

This guide explains how to read CPU usage from each of those tools, which one to reach for in which situation, and how to interpret common output fields.

Quick Reference

Tool Best for Command
top Live snapshot, sort by CPU top
htop Interactive, per-core view htop
mpstat Per-core sampling for scripts mpstat -P ALL 1 5
vmstat System-wide CPU and memory vmstat -y 1 5
sar Current or saved CPU samples sar -u 1 5
ps Per-process attribution ps -eo pid,user,%cpu,comm --sort=-%cpu | head
uptime Load average summary uptime
nproc Logical core count nproc
lscpu CPU topology details lscpu

Method 1: top

The top command is available on most Linux systems without any extra packages. Run it without arguments to open the live view:

Terminal
top

The header summarizes the CPU lines:

output
%Cpu(s): 4.2 us, 1.3 sy, 0.0 ni, 93.8 id, 0.5 wa, 0.0 hi, 0.2 si, 0.0 st

The fields tell you where CPU time goes. us is user-space code, sy is kernel code, id is idle, wa is time waiting for I/O, and st is time stolen by the hypervisor on a virtual machine. A high wa value points at slow disks rather than a CPU bottleneck.

Press 1 while top is open to switch from the aggregate line to one row per logical CPU. Press P to sort processes by CPU usage, M to sort by memory, and q to quit.

Method 2: htop

htop is an interactive replacement for top. It is available in the default repositories of most Linux distributions, but it may not be installed by default.

On Ubuntu, Debian, and Derivatives:

Terminal
sudo apt install htop

On Fedora, RHEL, and Derivatives:

Terminal
sudo dnf install htop

Run it the same way:

Terminal
htop

htop shows a colored bar per CPU at the top, a memory and swap bar, and a sortable process table below. Click a column header or use the function keys to sort. Search for a process with F3, filter with F4, and send a signal to a selected process with F9.

Method 3: mpstat

mpstat is part of the sysstat package and is the right tool when you need numeric CPU samples per core. Install it once before using mpstat or sar.

On Ubuntu, Debian, and Derivatives:

Terminal
sudo apt install sysstat

On Fedora, RHEL, and Derivatives:

Terminal
sudo dnf install sysstat

Sample all cores at one-second intervals five times:

Terminal
mpstat -P ALL 1 5
output
03:14:00 PM CPU %usr %nice %sys %iowait %irq %soft %steal %guest %gnice %idle
03:14:01 PM all 3.27 0.00 0.75 0.00 0.00 0.00 0.00 0.00 0.00 95.98
03:14:01 PM 0 4.95 0.00 0.99 0.00 0.00 0.00 0.00 0.00 0.00 94.06
03:14:01 PM 1 1.00 0.00 1.00 0.00 0.00 0.00 0.00 0.00 0.00 98.00

The all row is the aggregate. Each numbered row is a single logical CPU. Use this output when one core is pinned at 100 percent and the others are idle, which can happen when an application is single-threaded.

Method 4: vmstat

vmstat is part of procps and combines CPU usage with memory, swap, and I/O. The first report normally shows averages since boot, so use -y when you want only interval samples. The columns at the right are the CPU summary:

Terminal
vmstat -y 1 5
output
procs -----------memory---------- ---swap-- -----io---- -system-- ------cpu-----
r b swpd free buff cache si so bi bo in cs us sy id wa st
0 0 0 7430080 311288 1843264 0 0 8 18 148 263 3 1 96 0 0
0 0 0 7430080 311288 1843264 0 0 0 0 127 226 1 0 99 0 0

r is the run queue length, which is how many processes are ready to use a CPU. A run queue consistently larger than the number of CPUs is a sign of CPU pressure. The cpu columns mirror the meaning of the top header.

Method 5: sar

sar, also from sysstat, can print current samples and read saved activity logs. On Ubuntu and Debian, enable history collection after installing sysstat:

Terminal
sudo sed -i 's/^ENABLED="false"/ENABLED="true"/' /etc/default/sysstat
sudo systemctl enable --now sysstat

The collector setup differs between distributions. If sar shows no saved history, check your distribution’s sysstat service or timer configuration.

Show current CPU samples:

Terminal
sar -u 1 5
output
03:15:01 PM CPU %user %nice %system %iowait %steal %idle
03:15:02 PM all 2.34 0.00 0.71 0.05 0.00 96.90
03:15:03 PM all 2.18 0.00 0.69 0.04 0.00 97.09

Each row is a sample interval. Combine with -f to read an older log, for example sar -u -f /var/log/sysstat/sa10 for the tenth of the month on systems that store logs in /var/log/sysstat/. This is the right tool when you need to confirm that a slowdown reported yesterday lined up with a CPU spike.

Method 6: ps

The ps command lists every process and lets you sort by CPU percentage. The pattern most admins reach for is:

Terminal
ps -eo pid,user,%cpu,%mem,comm --sort=-%cpu | head
output
 PID USER %CPU %MEM COMMAND
1437 dejan 23.5 4.2 firefox
2049 dejan 11.2 2.8 node
1102 root 4.7 0.9 systemd-journal

The output is a snapshot at the moment ps ran. The %CPU value is the average CPU usage over the lifetime of the process, not an instantaneous reading. For a live view, repeat the command with watch:

Terminal
watch -n 2 'ps -eo pid,user,%cpu,%mem,comm --sort=-%cpu | head'

watch reruns the command every two seconds, which gives you a refreshing top-five view without leaving the shell.

Method 7: uptime and Load Averages

The uptime command is the smallest of the lot. Without arguments it prints the system uptime and the load average:

Terminal
uptime
output
 15:04:23 up 3:17, 2 users, load average: 0.42, 0.35, 0.31

The three numbers are the average number of processes that are runnable or in uninterruptible sleep over the last 1, 5, and 15 minutes. Compare them with nproc:

Terminal
nproc
output
8

A load average that stays below the core count is healthy. A load average well above the core count means processes are queueing for CPU time. The 15-minute value is the trend; the 1-minute value reacts to short spikes.

Method 8: Capacity Context

Before you read CPU usage, know what the host has. lscpu summarizes the CPU model, sockets, cores, and threads. For a deeper hardware view, see the guide on checking CPU information in Linux .

Terminal
lscpu
output
Architecture: x86_64
CPU op-mode(s): 32-bit, 64-bit
Address sizes: 46 bits physical, 48 bits virtual
Byte Order: Little Endian
CPU(s): 8
On-line CPU(s) list: 0-7
Vendor ID: GenuineIntel
Model name: Intel(R) Core(TM) i7-9700K CPU @ 3.60 GHz
Thread(s) per core: 1
Core(s) per socket: 8
Socket(s): 1

Thread(s) per core: 1 means hyper-threading is disabled or not present, so each logical CPU is a physical core. A high CPU usage on a chip with eight physical cores is different from the same number on a four-core chip with hyper-threading.

Troubleshooting

mpstat: command not found
The sysstat package is not installed. Install it with sudo apt install sysstat on Ubuntu, Debian, and Derivatives, or sudo dnf install sysstat on Fedora, RHEL, and Derivatives.

sar reports Cannot open /var/log/sysstat/
Sample collection is not enabled. Set ENABLED="true" in /etc/default/sysstat and restart the service with sudo systemctl restart sysstat. Wait at least one collection interval before rerunning sar.

top shows more than 100% CPU for one process
The default mode shows percentage relative to a single CPU, so a multi-threaded process can exceed 100 percent. Press Shift+I to toggle Irix mode off, and the value normalizes across all CPUs.

Load average looks high but no process consumes CPU
Load includes processes in D state, which is uninterruptible sleep. Check ps -eo state,pid,comm | awk '$1 ~ /D/' to find processes blocked on I/O. The cause is usually a slow or stalled disk.

Per-core view in htop is empty
Old terminal sizes hide the CPU bar. Resize the window or set Display options inside htop with F2.

FAQ

Which tool should I check first?
Run top or htop for a live picture, then drop to mpstat and sar when you need numbers or history. ps answers the per-process question once you know there is a problem.

What does %steal mean?
%steal is the time the hypervisor took from the guest VM to run something else. A consistent non-zero %steal value on a VM means the host is over-committed and the guest cannot get the CPU it asked for.

How do I count CPUs from a script?
Use nproc for the logical CPU count, or nproc --all to include offline CPUs. Both return a single integer and are stable across distributions.

Is high CPU always bad?
No. A batch job that finishes faster on a CPU running at full capacity is healthier than the same job spread thinly over a long period. CPU is bad when the load average exceeds the core count for sustained periods or when interactive workloads time out.

Conclusion

Pick the tool that matches the question. top and htop answer “what is happening right now”. mpstat and vmstat answer “is the load even across cores”. sar answers “what happened last night”. Treat load averages as a trend, not a verdict, and always read CPU numbers in the context of the core count from nproc.

❌